2 Aug 2026
Charting Successive Form Swings to Refine Multi-Leg Bet Structures
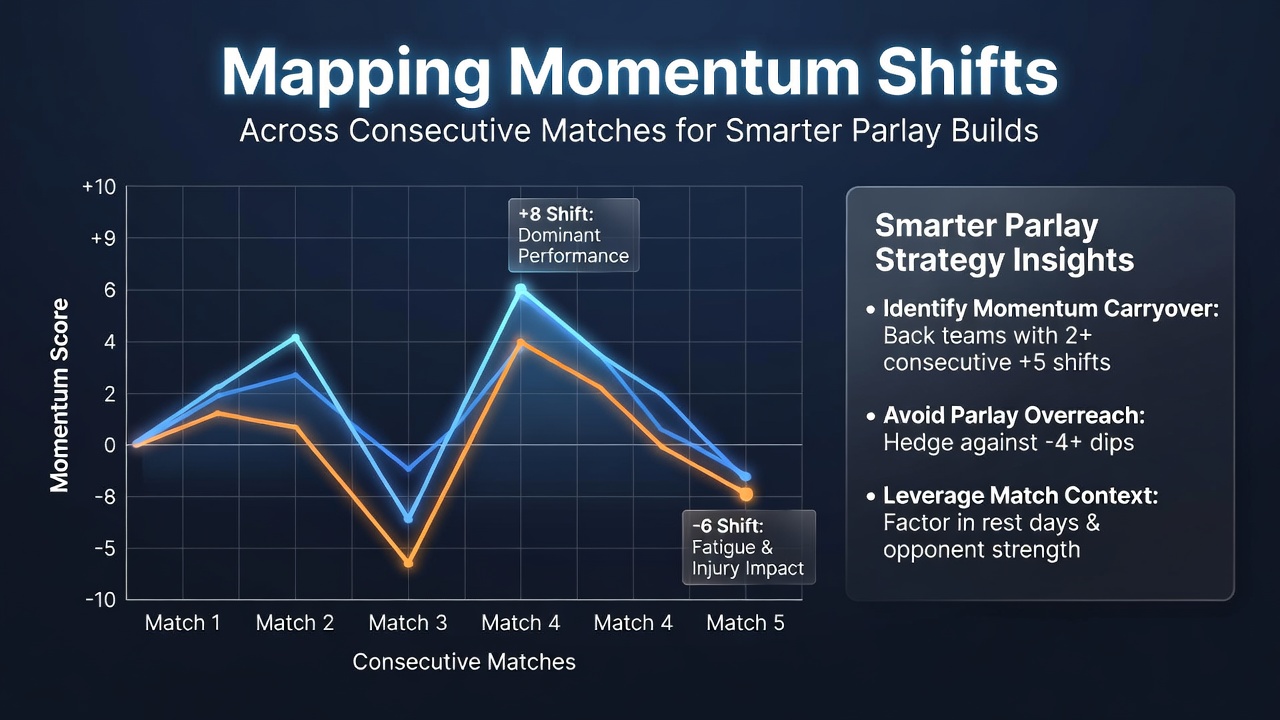
Analysts track performance patterns that emerge when teams or athletes compete in back-to-back fixtures, and data from these sequences often reveal shifts in scoring efficiency, defensive solidity, and recovery rates that influence later outcomes. Observers note that these trajectories appear across basketball leagues, soccer divisions, and tennis circuits where schedules force repeated engagements within short windows. Researchers at institutions such as the University of Queensland have compiled longitudinal datasets showing how win probabilities adjust after consecutive high-output games, and those adjustments feed directly into models that structure multi-leg selections.
Defining Momentum Through Sequential Metrics
Performance momentum surfaces when metrics such as points per possession, pass completion under pressure, or serve-hold percentages move consistently from one contest to the next. Statisticians isolate variables like rest days, travel distance, and opponent strength to isolate genuine form changes from noise, and the resulting indices help bettors identify where streaks may extend or reverse. Figures from the NCAA Division I basketball season illustrate that squads posting above-average offensive ratings in two straight games carry elevated totals projections into the third outing, while defensive lapses tend to compound across the same span.
Building Datasets for Pattern Recognition
Teams compile play-by-play logs, injury reports, and venue statistics from public repositories maintained by league offices and academic consortia. Analysts then align these records chronologically so that each match pair yields a delta value for key indicators. Software platforms aggregate these deltas into heat maps that highlight clusters where momentum has accelerated, and practitioners apply filters for schedule density to avoid conflating fatigue effects with genuine form surges. In August 2026 several European soccer federations began releasing granular rest-day data that feed these same pipelines, allowing earlier calibration of pre-season accumulators.
Application Across Sports with Dense Calendars
Basketball provides dense sequences because teams often play three or four times in seven days during conference play. Studies published in the Journal of Quantitative Analysis in Sports demonstrate that rebounding differentials stabilize after two consecutive games against similar competition, yet shooting percentages remain volatile. Soccer accumulators benefit when analysts map pressing intensity across midweek and weekend fixtures, because clubs that sustain high press volumes for three matches frequently see drop-offs in the fourth. Tennis circuits produce shorter but sharper momentum windows, particularly during clay-court swings where surface wear alters ball speed and footwork demands from one day to the next.
Integrating Shifts into Parlay Construction
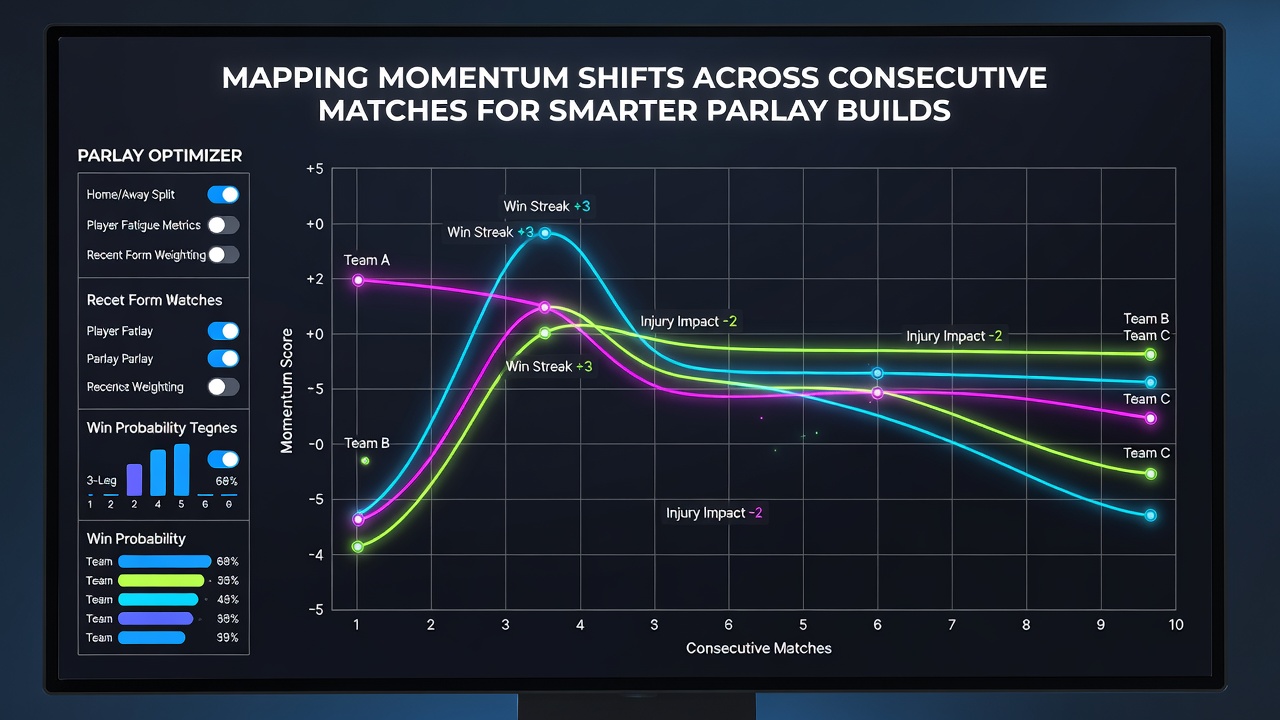
Parlay builders assign weights to each leg based on the direction and magnitude of the preceding momentum delta. A positive offensive trajectory across two matches might justify a higher stake on team totals, whereas a defensive regression signals caution on under selections. Correlation matrices help avoid stacking correlated outcomes, such as pairing a high-scoring team with an opponent whose defensive rating has deteriorated in the same window. Operators in regulated markets outside the UK, including those overseen by the Nevada Gaming Control Board, publish aggregated handle data that confirm elevated parlay volumes during periods when consecutive-match analytics become publicly accessible.
Validation Through Historical Back-Tests
Independent researchers run rolling-window simulations that test momentum-adjusted probabilities against actual results from completed seasons. These exercises consistently show improved calibration when models incorporate at least three prior matches rather than single-game samples, and the largest gains appear in mid-season segments where schedule fatigue compounds. One dataset covering Australian Football League contests between 2018 and 2025 revealed that teams with positive momentum deltas across consecutive rounds produced 4.2 percent higher scoring margins than baseline expectations, a margin sufficient to shift multi-leg payout thresholds when applied consistently.
Limitations and Complementary Factors
External variables such as weather, referee assignments, and last-minute roster changes can override momentum signals, so practitioners maintain secondary checks that include injury timelines and travel logs. Real-time data feeds allow rapid recalculation when lineups lock, yet the core sequence remains anchored to the consecutive-match record. Observers emphasize that these tools function as probability modifiers rather than guarantees, and long-term records demonstrate that disciplined bankroll allocation alongside momentum mapping produces steadier results than isolated streak chasing.
Conclusion
Mapping momentum shifts across consecutive matches supplies a structured lens for evaluating multi-leg selections. By aligning sequential performance deltas with schedule context, analysts generate refined probability inputs that account for form trajectories rather than isolated results. Continued expansion of granular datasets from leagues and academic sources will likely sharpen these methods further, offering practitioners additional layers for constructing accumulators that reflect observed patterns in successive contests.