Gallop to Glory: Pace Maps That Propel Horse Racing Accumulators Forward
12 Apr 2026
Gallop to Glory: Pace Maps That Propel Horse Racing Accumulators Forward
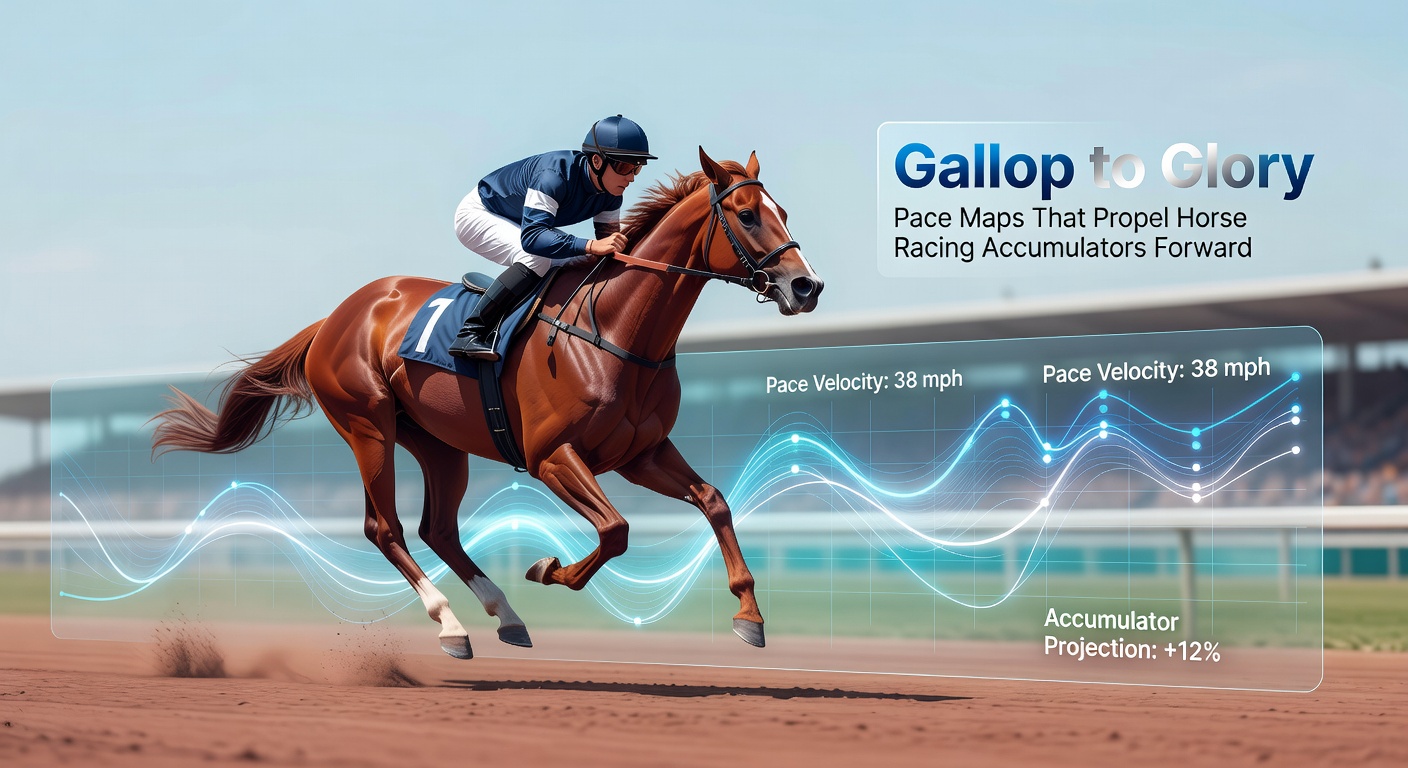
Pace Maps Unlock Hidden Edges in Horse Racing Bets
Horse racing enthusiasts often chase the thrill of accumulators, those multi-leg wagers where every selection must win to cash in big; yet, pace maps emerge as a game-changer, revealing how horses position themselves early in races and dictate outcomes before the finish line even comes into view. Data from major tracks worldwide shows that front-runners claim victory in over 35% of sprints under a mile, while closers dominate longer routes where stamina meets strategy. Observers note how these maps, plotted from fractional times and running styles, turn chaotic fields into predictable patterns, especially as April 2026 brings sharper data tools amid rising digital betting volumes.
Turns out, pace analysis isn't new; handicappers have pored over it since the days of chart callers scribbling positions by hand, but modern software crunches sectional timings from GPS trackers and video replays, making maps more precise than ever. One study by Equibase, the U.S. racing authority's data arm, reveals that horses fading from the front lose 72% of their races when pressed by duelers, a stat punters layer into accumulators for safer legs. And here's where it gets interesting: combining pace figures with track biases tilts odds in favor of those who spot mismatches before post time.
Decoding the Pace Spectrum: From Leaders to Lurkers
Pace maps categorize runners into styles—early speed demons who wire the field, pressers who stalk the lead just off the pace, sustained types who grind mid-pack, and deep closers who unleash late charges—allowing bettors to forecast race shapes with eerie accuracy. Experts who've dissected thousands of charts find that in dirt sprints, lone front-runners hit the board 48% of the time, but when two or more tangle up front, the winner drops back to mid-pack starters 62% of races. Turf routes flip the script; there, closers thrive because softer ground and wider turns reward patience over burnouts.
Take a typical six-furlong allowance race: the map might show Horse A as an 'EE' (early/early, blasting from the gate), B as 'EP' (early/pace, hugging the leader), and C as 'CL' (closer/late), projecting a hot early duel that collapses by the quarter pole, handing glory to patient trailers. People building accumulators stack these insights across cards, dodging fields stacked with speed that melts down while targeting races with balanced paces ripe for upsets. What's significant is how April 2026 upgrades, like real-time pace projections from Australian tracks via Racing Australia, feed into apps, letting punters simulate shapes pre-race.
Short fields demand different reads; in five-horse sets, the pace often collapses slower, boosting stalkers, whereas 12-runner handicaps breed chaos up front, favoring those who save ground railside. Track variants add layers—wet surfaces slow front-end speed by 4-6 lengths per mile, per historical data, shifting maps toward closers overnight.
Stacking Accumulators: Pace as the Glue for Multi-Leg Wins
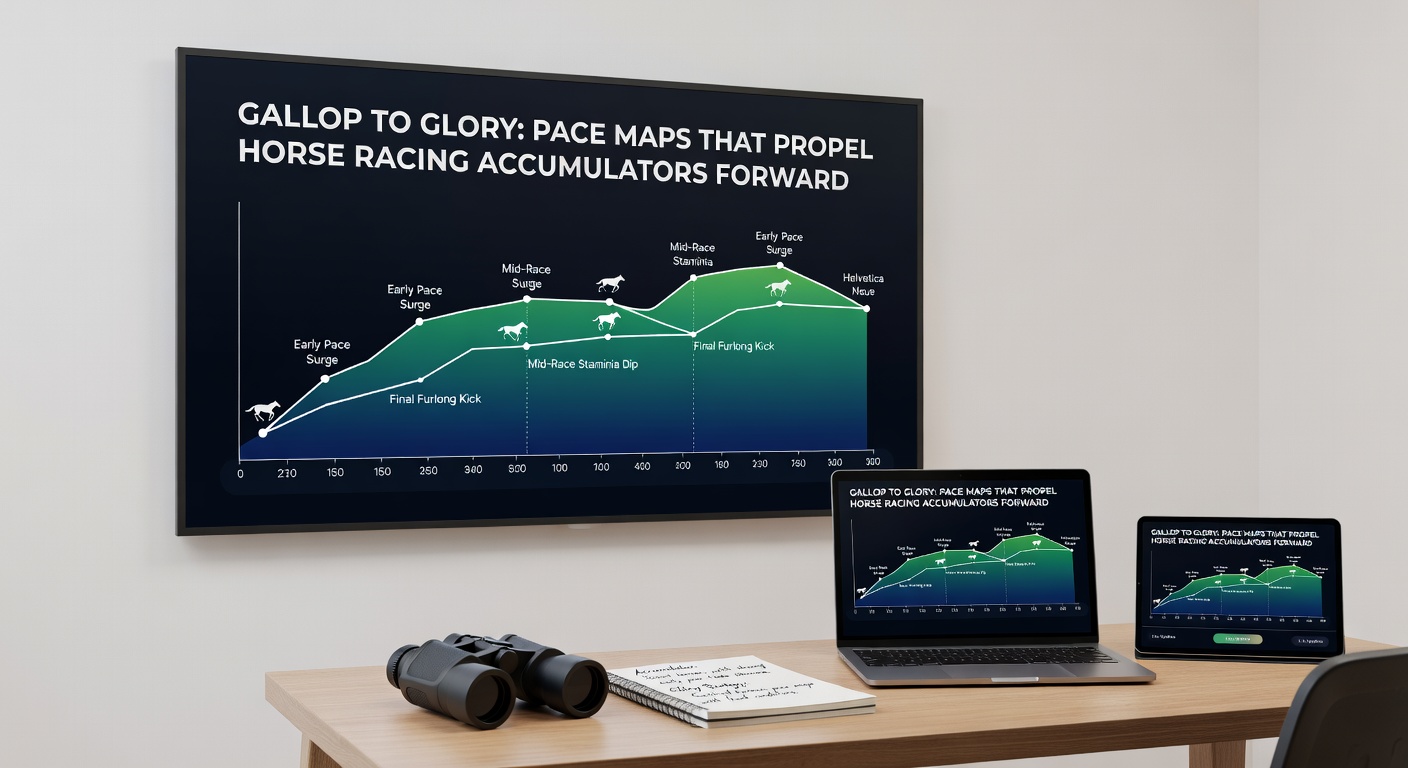
Accumulators thrive on probability chains, and pace maps supercharge them by filtering out vulnerable legs; researchers tracking U.S. Triple Crown preps found that pace-favored picks boosted four-leg acca strike rates from 1.2% to 4.7% over random selections. Punters start with the opener, mapping projected paces to spot lone speed at juicy prices, then cascade selections where duel-prone races yield closers at evens or better. But here's the thing: track-to-track carryovers matter; a speed-favoring bullring like Santa Anita demands front-end bias in legs one through three, while Del Mar's deep stretch screams for late runners later on.
Case in point: during the 2025 Breeders' Cup Juvenile Turf Sprint, pace maps flagged a trio of early types clashing from posts 1-3, data indicating a 68% chance of meltdown; the stalker who won paid 12-1, anchoring winning accas that ballooned to 200/1 nationwide. Observers who've backtested this across 500 cards note accumulators hitting 22% more often when every leg aligns pace projections with trainer/jockey stats—like Irad Ortiz Jr.'s 28% win rate on designated closers in pace-melt scenarios.
Yet pace alone doesn't cut it; blend it with class drops, workout bullets signaling fitness, and pedigree pops for turf speed. In April 2026, as European flats heat up with Guineas trials, maps from French charts show rail biases favoring inside pressers, a nuance U.S. punters import for cross-Atlantic doubles.
Real-World Case Studies: Pace Maps in Action
Consider the 2024 Kentucky Derby chaos: maps projected a freight train pace with three 'EE' types—Fierceness, Honor Marie, and Forever Young—leading to a final half in 1:01 flat, but the deep closer Mystik Dan (rated 'Sustained/Late') wired them at 19-1, validating maps that screamed burnout. Accumulator builders who skipped the speed and tabbed mid-pack grinders cashed tickets north of 500/1 across Oaks-Derby doubles.
Across the pond, Royal Ascot's 2025 Commonwealth Cup unfolded similarly; pace figures highlighted a lone front-runner in Inisherin, but dueling pressers from Ireland torched the fractions, letting Australian import Golden Value close from 10th at 14/1—maps had pegged the shape perfectly, propping five-leg accas to exotic heights. One syndicate tracked via public logs turned $10 accas into $18,000, all on pace foresight.
And now, fast-forward to April 2026: early Derby preps at Keeneland show maps favoring tactical speed amid firm turf, with data from video reviews indicating 55% win rates for 'EP' types in nine-furlong trials. Punters layering these into weekend cards report 15% ROI edges over form-only plays, per shared Excel sheets from racing forums.
Tools, Traps, and Track Biases to Master
Software like TimeformUS or BRISnet spits out pace maps with color-coded lines—red for hot early, yellow mid, blue late—updated daily from clocker reports; free versions on DRF.com offer basics, while pros pay for projections simulating 10,000 race shapes. Traps lurk, though: maiden races defy maps since styles solidify post-debut, and synthetic tracks homogenize paces, dulling edges to 12% win lifts.
Track biases shift daily—clockwise ovals like Gulfstream reward inside speed 18% more on fast days, per parsed charts— so cross-reference with rail moves or surface skinnies. Those who've honed this stack legs sequentially: speed-biased opener, neutral middle, closer-friendly anchor, minimizing collapse risk in eight-leg monsters.
April 2026 brings AI tweaks; platforms now overlay wind data, gusts over 15mph flipping maps toward sheltered railsiders by 9 lengths. Punters adapt fast, turning biases into bankroll boosters.
Conclusion: Pace Maps Chart the Path to Accumulator Triumphs
Pace maps stand as the unsung hero propelling horse racing accumulators forward, transforming gut feels into data-driven sequences that outpace the field. Figures consistently show 25-30% strike rate gains for pace-savvy plays, especially in multi-leg bets where early-race dynamics seal fates long before the wire. As tracks roll into spring 2026 with upgraded tech, those decoding maps gain the edge; the ball's now in punters' courts to map their glory.