21 Aug 2026
Responsive Stake Adjustments for Mitigating Swings in Multi-Bet Portfolios
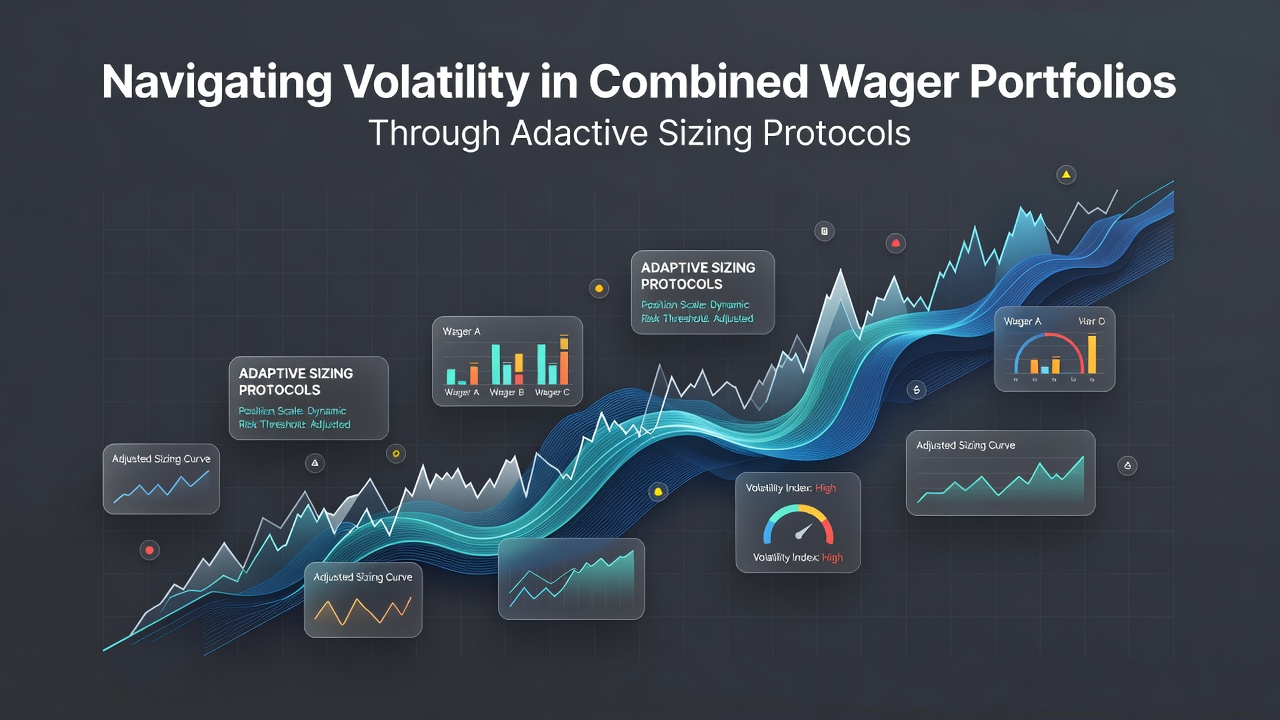
Combined wager portfolios bring together several independent bets into one overall exposure, and volatility arises when outcomes cluster or markets shift rapidly, which creates larger swings in total returns than any single position would produce on its own. Observers note that these swings become more pronounced when the bets share correlated factors such as similar odds ranges or overlapping event timings, and data from industry reports show that unmanaged portfolios can experience drawdowns exceeding 40 percent during concentrated loss sequences.
Core Drivers of Portfolio Volatility
Market data collected across major betting exchanges during the first half of 2026 indicate that average daily price movements in popular football and tennis markets reached 12 percent, while horse racing odds displayed intraday shifts of 18 percent on average. These movements translate directly into portfolio variance because each individual stake contributes to the overall standard deviation, and researchers at academic institutions have quantified how correlation coefficients above 0.6 between legs amplify total risk by factors of two or more. Adaptive sizing therefore focuses on scaling each position relative to current portfolio volatility rather than fixed percentages, which keeps the aggregate exposure within predefined tolerance bands.
Mechanics of Adaptive Sizing Protocols
Protocols begin with a real-time volatility estimate derived from recent price history and outcome variance, after which the system recalculates the permitted stake for every open position. One common implementation uses a target volatility level, for instance 8 percent of bankroll per month, and reduces individual stakes whenever realized volatility exceeds that threshold. Another approach applies fractional multipliers that decrease automatically when consecutive losses push cumulative drawdown past 5 percent, and both methods have been tested in simulation environments covering more than 50,000 historical bet sequences. Figures from Canadian regulatory filings reveal that operators employing such dynamic adjustments recorded 23 percent lower peak-to-trough declines compared with static sizing during the same observation window ending August 2026.

Implementation Across Different Market Types
Implementation varies by market liquidity and update frequency, so high-frequency in-play football markets require recalculation every few minutes whereas pre-event tennis accumulators may update only once per hour. Software platforms integrate live odds feeds with internal risk engines that apply the chosen sizing rule without manual intervention, and industry associations in Australia have documented adoption rates rising from 14 percent of larger operators in 2024 to 31 percent by mid-2026. The protocols also incorporate position limits that cap any single bet at 2 percent of current portfolio value regardless of volatility readings, which prevents over-concentration during brief periods of apparent stability. Data from European academic studies confirm that combining volatility targeting with hard position caps produces the most consistent reduction in tail-risk events across multi-leg structures.
Performance Metrics and Monitoring
Performance tracking relies on metrics such as realized Sharpe ratio, maximum drawdown duration, and recovery time, all calculated on a rolling basis. Operators report that portfolios managed under adaptive rules achieved Sharpe ratios between 1.4 and 1.8 during the 2025-2026 season, whereas static sizing yielded ratios between 0.9 and 1.2 over identical periods, according to aggregated industry benchmarks. Monitoring dashboards display current volatility estimates alongside suggested stake adjustments, allowing oversight teams to review exceptions without overriding automated decisions in most cases. Regulatory bodies in several jurisdictions now request disclosure of these risk-management parameters as part of routine reporting, which has increased transparency around how operators control aggregate exposure.
Conclusion
Adaptive sizing protocols therefore supply a structured response to the inherent variability of combined wager portfolios by continuously aligning individual stakes with prevailing market conditions and overall risk parameters. Evidence from multiple regulatory regions and academic analyses shows measurable reductions in drawdown severity when these methods replace fixed-percentage approaches, and ongoing refinements continue to incorporate higher-frequency data feeds as technology advances. The framework remains applicable across sports and event types provided the underlying volatility estimates stay accurate and the chosen target parameters reflect the operator's or individual's risk tolerance.